RIWIS Bautätigkeit Bürogebäde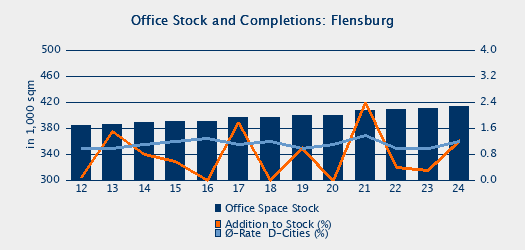
| Office Stock and Completions: Flensburg | | | 2016 | 2017 | 2018 | 2019 | 2020 | 2021 | 2022 | 2023 | Δ 19-23 | | office stock, net floorspace (RA-C, gif) in 1,000 sqm | 391 | 397 | 397 | 401 | 401 | 408 | 410 | 410 | 2.3 % | | avg floorspace per office employee (sqm) | 20.0 | 20.0 | 19.6 | 19.7 | 20.2 | 20.9 | 20.6 | 20.3 | 3.0 % | | | | | | | | | | | Ø 19-23 | | completion (sqm) | 0 | 7,200 | 0 | 3,900 | 0 | 9,600 | 1,800 | 1,100 | 3,280 | | addition to stock in % of stock | 0.0 % | 1.8 % | 0.0 % | 1.0 % | 0.0 % | 2.4 % | 0.4 % | 0.3 % | | | | | Completions and Planning Permissions according to Official Statistics | | | 2016 | 2017 | 2018 | 2019 | 2020 | 2021 | 2022 | 2023 | Ø 19-22 | | completion: floorspace in office buildings (sqm) | 4,778 | | 5,273 | 4,288 | | 8,643 | 4,385 | | 5,772 | | planning permission: floorspace in office buildings (sqm) | 660 | | 3,628 | 5,023 | 7,308 | 4,204 | 11,136 | | 6,918 | | planning permission surplus | -4,118 | | -1,645 | 735 | | -4,439 | 6,751 | | 1,016 |
|
|