RIWIS Kaufkraft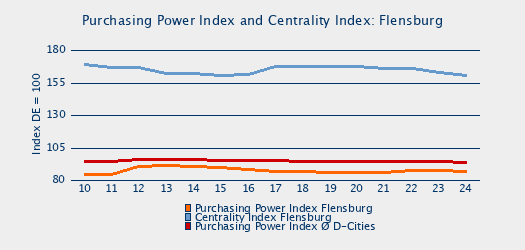
| Purchasing Power: Flensburg | | | | Index: BRD = 100 | 2017 | 2018 | 2019 | 2020 | 2021 | 2022 | 2023 | Δ 18-23 | | Flensburg | | Purchasing Power Index | 87.8 | 86.7 | 86.7 | 86.9 | 87.2 | 88.1 | 88.3 | 1.6 | | Centrality Index | 167.6 | 167.8 | 168.0 | 167.8 | 165.8 | 166.5 | 163.2 | -4.6 | | Purchasing Power per Capita (€) | 19,619 | 20,118 | 20,463 | 20,770 | 21,308 | 23,015 | 23,733 | 18.0% | | Retail-Related Purchasing Power Index | 95.7 | 94.8 | 94.2 | 92.9 | 91.9 | 91.8 | 92.5 | -2.3 | | Retail-Related Purchasing Power per Capita (Euro) | 6,297 | 6,564 | 6,674 | 6,351 | 6,214 | 6,687 | 6,906 | 5.2% | | Schleswig-Holstein | | Purchasing Power Index | 99.6 | 99.7 | 100.0 | 100.6 | 100.6 | 100.6 | 100.6 | 0.9 | | Purchasing Power per Capita (€) | 22,258 | 23,117 | 23,604 | 24,069 | 24,571 | 26,289 | 27,033 | 16.9% | | Deutschland | | Purchasing Power per Capita (€) | 22,351 | 23,194 | 23,616 | 23,914 | 24,427 | 26,121 | 26,870 | 15.8% |
|
|