RIWIS Verfügbares Einkommen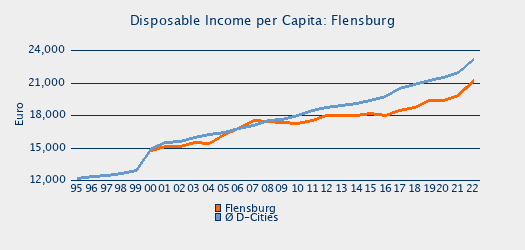
| Disposable Income (Revision 2011) of Private Households: Flensburg | | | | | 2017 | 2018 | 2019 | 2020 | 2021 | 2022 | Δ17-22 | | Flensburg | | in Million € | 1,627 | 1,669 | 1,741 | 1,749 | 1,798 | 1,940 | 19.3% | | per Capita (Euro) | 18,493 | 18,753 | 19,379 | 19,427 | 19,868 | 21,130 | 14.3% | | per Household (Euro) | 33,634 | 33,942 | 35,141 | 35,208 | 36,019 | 38,461 | 14.4% | | Disposable/Primary Income Rate | 84.9 % | 84.6 % | 84.4 % | 87.3 % | 86.5 % | 87.5 % | | | Schleswig-Holstein Nord (RO-Region) | | in Million € | 10,269 | 10,563 | 11,091 | 11,127 | 11,402 | 12,342 | 20.2% | | per Capita (Euro) | 22,701 | 23,249 | 24,312 | 24,273 | 24,723 | 26,495 | 16.7% | | per Household (Euro) | 44,481 | 45,363 | 47,292 | 47,059 | 48,056 | 51,993 | 16.9% | | Disposable/Primary Income Rate | 89.0 % | 89.0 % | 88.7 % | 90.6 % | 89.9 % | 89.0 % | | | Schleswig-Holstein | | in Million € | 65,265 | 67,873 | 69,676 | 70,783 | 72,738 | 77,776 | 19.2% | | per Capita (Euro) | 22,615 | 23,459 | 24,024 | 24,347 | 24,941 | 26,476 | 17.1% | | per Household (Euro) | 44,787 | 46,350 | 47,331 | 47,815 | 48,938 | 52,127 | 16.4% | | Disposable/Primary Income Rate | 84.1 % | 84.3 % | 84.0 % | 86.0 % | 85.3 % | 84.5 % | | | Germany | | in Million € | 1,844,458 | 1,920,281 | 1,961,183 | 1,986,970 | 2,035,553 | 2,164,467 | 17.3% | | per Capita (Euro) | 22,315 | 23,162 | 23,602 | 23,893 | 24,467 | 25,830 | 15.8% | | per Household (Euro) | 43,849 | 45,375 | 46,115 | 46,595 | 47,495 | 50,278 | 14.7% | | Disposable/Primary Income Rate | 81.3 % | 81.3 % | 81.0 % | 83.2 % | 82.4 % | 82.1 % | |
|
|