RIWIS Kaufkraft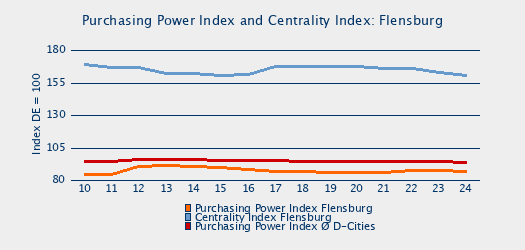
| Purchasing Power: Flensburg | | | | Index: BRD = 100 | 2019 | 2020 | 2021 | 2022 | 2023 | 2024 | 2025 | Δ 20-25 | | Flensburg | | Purchasing Power Index | 86.0 | 85.2 | 85.2 | 86.2 | 85.9 | 85.5 | 85.3 | 0.1 | | Centrality Index | 168.0 | 167.8 | 165.8 | 166.5 | 163.2 | 160.8 | 156.8 | -11.0 | | Purchasing Power per Capita (€) | 21,282 | 21,097 | 21,698 | 23,446 | 24,809 | 25,644 | 26,057 | 23.5% | | Retail-Related Purchasing Power Index | 94.2 | 92.9 | 91.9 | 91.8 | 92.5 | 91.9 | 90.8 | -2.1 | | Retail-Related Purchasing Power per Capita (Euro) | 6,674 | 6,351 | 6,214 | 6,687 | 6,906 | 6,933 | 7,131 | 12.3% | | Schleswig-Holstein | | Purchasing Power Index | 100.0 | 100.5 | 100.0 | 100.6 | 100.3 | 100.3 | 100.3 | -0.2 | | Purchasing Power per Capita (€) | 24,730 | 24,874 | 25,447 | 27,354 | 28,969 | 30,082 | 30,655 | 23.2% | | Deutschland | | Purchasing Power per Capita (€) | 24,735 | 24,756 | 25,457 | 27,201 | 28,873 | 29,992 | 30,555 | 23.4% |
|
|