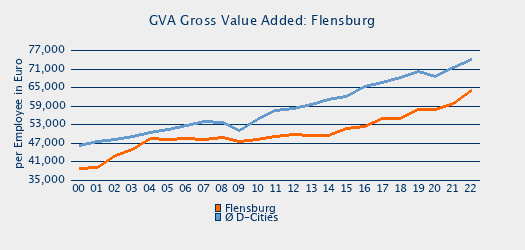
RIWIS Bruttowertschöpfung
| Gross Value Added by Industries 2022: Flensburg - WZ08/2014 | | | Agriculture, Forestry and Fishing | Industry incl. Energy | Services | Services: Trade and Transport | Services: Financial, Renting and Business Activities | GVA per Employee in Euro | | Flensburg | 0.0 % | 20.7 % | 79.3 % | 25.2 % | 19.7 % | 63,938 | | Schleswig-Holstein Nord (RO-Region) | 3.5 % | 25.2 % | 71.3 % | 20.5 % | 22.0 % | 66,874 | | Schleswig-Holstein | 1.9 % | 25.6 % | 72.4 % | 23.9 % | 22.1 % | 70,542 | | Germany | 1.0 % | 29.7 % | 69.3 % | 21.9 % | 25.2 % | 76,972 |
| | Gross Value Added in Million Euro: Flensburg - WZ08/2014 | | Million € | 2016 | 2017 | 2018 | 2019 | 2020 | 2021 | 2022 | Δ 17-22 | | Flensburg | 3,112 | 3,303 | 3,363 | 3,578 | 3,542 | 3,616 | 3,941 | 19.3 % |
|
|
