|
| |
RIWIS SVP Beschäftigung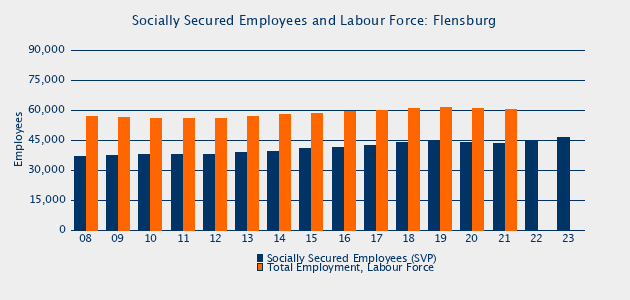
| Employees Subject to Social Insurance Contributions (SVP): Flensburg | | | | | 2019 | 2020 | 2021 | 2022 | 2023 | 2024 | Δ 19-24 | | Flensburg | 44,607 | 43,981 | 43,469 | 44,831 | 46,453 | 47,048 | 5.5 % | SVP Employment by Industry (WZ): Flensburg
Please note: until 2008 WZ03, from 2009 WZ08, ->more Info | | Agriculture, Forestry and Fishing | 0.0 % | 0.0 % | 0.0 % | 0.0 % | 0.0 % | 0.0 % | | | Manufacturing | 11.3 % | 11.5 % | 10.9 % | 10.8 % | 11.0 % | 11.5 % | | | Construction | 2.9 % | 3.0 % | 2.9 % | 2.9 % | 2.8 % | 2.8 % | | | Wholesale and Retail Trade | 17.7 % | 17.5 % | 17.6 % | 17.3 % | 17.2 % | 16.9 % | | | Hotels and Restaurants | 3.3 % | 3.1 % | 3.4 % | 3.4 % | 3.4 % | 3.3 % | | | Transport, Storage and Communication | 7.9 % | 7.7 % | 8.2 % | 8.5 % | 8.4 % | 8.2 % | | | Financial Services | 1.5 % | 1.6 % | 1.7 % | 1.6 % | 1.6 % | 2.0 % | | | Real Estate, Renting and Business Activities | 14.8 % | 14.0 % | 13.2 % | 13.0 % | 14.0 % | 13.7 % | | | Public Administration, Compulsory Social Security | 9.3 % | 9.5 % | 9.7 % | 9.6 % | 9.4 % | 8.8 % | | | Education, Health and Social Work | 25.0 % | 25.7 % | 26.3 % | 26.9 % | 26.2 % | 26.8 % | | | Other Activities | 4.6 % | 4.6 % | 4.3 % | 4.2 % | 4.4 % | 4.4 % | | | | | Schleswig-Holstein Nord (RO-Region) | 162,120 | 161,761 | 165,614 | 170,154 | 172,201 | 173,367 | 6.9 % | | Schleswig-Holstein | 1,000,213 | 1,002,902 | 1,023,488 | 1,043,551 | 1,052,392 | 1,058,498 | 5.8 % | | Germany | 33,407,262 | 33,322,952 | 33,802,173 | 34,445,087 | 34,709,056 | 34,837,102 | 4.3 % |
|
| © bulwiengesa AG; RIWIS 2025 |
|